Davis International ADR SMA
Portfolio Commentary
Winter Update 2024
Portfolio Commentary
Winter Update 2024
Key Takeaways
- The MSCI ACWI (All Country World Index) ex US returned 15.62% in 2023. International markets underperformed the U.S. due to a number of headwinds, including elevated inflation and interest rates in Europe, and China’s slow economic recovery.
- Davis International ADR SMA portfolio is built around a highly selective list of well-researched businesses with very attractive characteristics based on bottom-up stock selection guided by some long-tailed themes in foreign markets.
- Looking forward, we believe our overall portfolio positioning is advantaged given its low starting valuations, comparatively high earnings growth potential, and the competitive and financial strength of the underlying holdings.
Net Average Annual Total returns as of December 31, 2023, for Davis International Equity SMA Composite with a 3% maximum wrap fee: 1 year, -6.48%; 5 years, 0.20%; inception, -0.27%. The performance presented represents past performance and is not a guarantee of future results. Total return assumes reinvestment of dividends. Investment return and principal value will vary so that an investor may lose money. For current, quarterly returns, please ask your financial advisor to contact Davis Advisors. Current performance may be higher or lower. The investment strategies described herein are those of Davis Advisors. These materials are being provided for illustrative and informational purposes only. The information contained herein is obtained from multiple sources that are believed to be reliable. However, such information has not been verified, and may be different from the information included in documents and materials created by the sponsor firm in whose investment program a client participates. Some sponsor firms may require that these materials are preceded or accompanied by investment profiles or other documents or materials prepared by such sponsor firms, which will be provided upon a client’s request. For additional information, documents and/or materials, please speak to your Financial Advisor.
Market Perspectives:
Regional Headwinds
In 2023 the MSCI ACWI ex US returned 15.62%. International markets have lagged the U.S. in recent years for reasons that are largely regional in nature. In Europe, inflation and interest rates remain elevated. As such, the European Central Bank has maintained its tightening stance with respect to interest rates, and there appear to be growing signs of a slowdown in some of the larger European economies. That said, we see numerous attractive opportunities in European markets, in which we are investing selectively.
In Asia-Pacific, China has been slow to find its economic footing after a very prolonged shutdown due to COVID, a fact that has weighed on the growth rate of the entire region. While China’s recovery has required patience, we firmly believe its economic activity level and vibrancy will improve in the foreseeable future, and that this is a moment to consider owning Chinese equities. To put the present opportunity into perspective, Chinese equities today have rarely been cheaper in our estimation, both in absolute and relative terms. Given this, we have seen net purchasers of China-related stocks at the margin.
In summary, international markets offer many well-priced investment opportunities today for the patient investor. Still, we believe that selectivity will be a key to building value for shareholders over the coming years.
Portfolio Review:
Long-Tailed Themes, Best-of-Breed Stocks
In 2023 Davis International ADR SMA portfolio trailed the benchmark by a meaningful extent. The greatest performance drag were Chinese stocks. Price-to-earnings (P/E) ratios for most of our China-related holdings, which range from technology and food delivery services to multi-line insurance, are in the mid-single digit range. Business results have been stabilizing or improving, and we believe the current lack of investment interest in some of the world’s most innovative businesses offers a rare opportunity for investors willing to be somewhat contrarian.
In terms of overall positioning, the portfolio is built around a highly selective list of well-researched businesses and its characteristics are very attractive, in our view.
In the following table we compare the portfolio with the index with respect to three key metrics—the number of holdings, five-year trailing average annual earnings per share growth rate, and the average forward price-to-earnings (P/E) multiple.
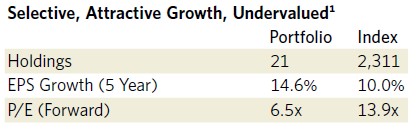
With 21 portfolio holdings, we are capitalizing on the opportunity as active managers to own only what we feel are best-of-breed companies with attractive future prospects. In contrast, the unmanaged index is rather indiscriminately allocated across thousands of names, most of which we consider less attractive. Within reason and subject to diversification considerations, we believe that owning fewer holdings and focusing on what we deem superior companies can be an advantage versus the passive alternative.
Our five-year earnings per share growth rate demonstrates the level of historical growth that our businesses have been able to achieve on balance. Relative to the benchmark, the portfolio has generated higher earnings per share growth rates even while its P/E is much lower than that of the index.
In our experience, this combination of selectivity, low starting valuations, and long-term earnings growth can provide an attractive balance of risk and reward and can combine to deliver powerful results over the long term.
Three Primary Themes
In addition to stock selection, we are guided at the portfolio management level by long-tailed themes where we can concentrate our research efforts. In effect, this means that we seek to “fish where the fish are” in terms of broad areas of the international markets. Three of the primary themes running through Davis International ADR SMA portfolio include: (1) high-grade financials, (2) a broad swath of technology companies, and (3) select industrials.
Within financials, we favor competitively advantaged, very durable financial institutions in multiple geographies, including Europe and parts of Asia-Pacific.
In Europe, we hold shares of Swiss bank Julius Baer which is going through somewhat of a transition. Despite some negative headlines in recent periods, we like Julius Baer’s core private banking franchise which is sticky and highly profitable, as well as its cheap valuation currently.
In Asia-Pacific, we own shares of AIA Group, a multi-line insurance giant that is well-positioned to capitalize on that region’s expected long-term ramp in insurance demand, particularly in life insurance products. The major Asian financial institutions include some of the most digitally sophisticated and tech-forward businesses in the world with exceptionally lean expense structures as a result. A number of them have better economics in terms of margins and even market share than their U.S. counterparts.
Technology, the second principal theme running through the Davis International ADR SMA portfolio, spans multiple areas including e-commerce, gaming and semiconductor-related companies.
Consumer-facing technology holdings that we like today are e-commerce leaders in China and South Korea. In the short term, these companies’ share prices were down in 2023, reflecting the malaise in China’s economy post-COVID lockdowns, above all. Longer-term, we expect the region’s general level of economic activity, e-commerce traffic and broader consumption trends to improve markedly, however unknowable the exact timing may be. In the meantime, we are very comfortable owning these types of businesses. They have strong competitive positions and extraordinarily cheap valuations for what are normally high-growth profit models, and we expect that their sectors should do well over time relative to other areas of the market.
Within industrials, we own positions in a European multinational leader in electrical equipment and components which is headquartered in France but global in operations. We also own a company that distributes plumbing, heat and water supplies which is listed in London but derives most of its earnings in foreign markets, including and especially the U.S., where the company has strong relationships with contractors.
In Asia-Pacific, we have owned shares of HollySys Automation Technologies for a number of years. The company is slated to be acquired in the near future and taken private at a price that would make it one of our more successful investments.
In addition to the above themes, we have many individual positions that are rather unique and do not fall neatly into a broader theme per se. Whether grouped by theme or based on more stand-alone theses, note that we select all of our investments on a case-by-case, company-by-company basis according to a single, clear-minded investment philosophy and discipline.
Outlook:
Advantaged Positioning
The international stock markets are really various markets of many individual stocks from which investors can pick and choose. We are exercising extreme selectivity to maximize what we believe are the most attractive opportunities across regions. In addition, we believe the overall positioning of Davis International ADR SMA portfolio is advantaged given a rare combination of low starting valuations (in absolute and relative terms), comparatively high earnings growth potential, and the overall competitive and financial strength of the underlying holdings.
In conclusion, as stewards of our clients’ savings our most important job is growing the value of the funds entrusted to us. With more than $2 billion of our own money invested alongside that of our clients, we are on this journey together.2 This alignment with our clients is uncommon in our industry; our conviction in our portfolio of carefully selected companies is more than just words.
We are grateful for your trust and well-positioned for the future.
The performance of mutual funds is included in the Composite. The performance of the mutual funds and other Davis managed accounts may be materially different. For example, the Davis International Fund may be significantly larger than another Davis managed account and may be managed with a view toward different client needs and considerations. The differences that may affect investment performance include, but are not limited to: the timing of cash deposits and withdrawals, the possibility that Davis Advisors may not buy or sell a given security on behalf of all clients pursuing similar strategies, the price and timing differences when buying or selling securities, the size of the account, the differences in expenses and other fees, and the clients pursuing similar investment strategies but imposing different investment restrictions. This is not a solicitation to invest in the Davis International Fund or any other fund.
Davis Advisors International Equity Composite returns for the period of 1/1/05 through 12/31/06 represent a carve out position from the Davis Global Equity Composite. Davis Advisors has computed the performance by removing all U.S. securities from the Global Equity Composite. For current Global Equity Composite returns, please ask your financial advisor to contact Davis Advisors.
Effective 9/23/14, Davis Advisors created an International Equity SMA Composite which excludes the institutional accounts and mutual funds. Performance shown from 10/1/14, through the date of this material, the Davis Advisors’ International Equity SMA Composite includes all eligible wrap accounts with no account minimum from inception date for the first full month of account management and includes closed accounts through the last day of the month prior to the account’s closing.
A time-weighted internal rate of return formula is used to calculate performance for the accounts included in the Composite. The net of fees rate of return formula is calculated based on a hypothetical 3% maximum wrap fee charged by the wrap account sponsor for all account services. For the gross performance results, custodian fees and advisory fees are treated as cash withdrawals.
Davis Advisors is committed to communicating with our investment partners as candidly as possible because we believe our clients benefit from understanding our investment philosophy and approach. Our views and opinions include “forward-looking statements” which may or may not be accurate over the long term. Forward-looking statements can be identified by words like “believe,” “expect,” “anticipate,” or similar expressions. You should not place undue reliance on forward-looking statements, which are current as of the date of this material. We disclaim any obligation to update or alter any forward-looking statements, whether as a result of new information, future events, or otherwise. While we believe we have a reasonable basis for our appraisals and we have confidence in our opinions, actual results may differ materially from those we anticipate.
This material discusses companies in conformance with Rule 206(4)-1 of the Investment Advisers Act of 1940 and guidance published thereunder. Six companies are discussed and are chosen as follows: (1-4) current holdings based on December 31 holdings; (5) the first new position; and (6) the first position that is completely closed out. Starting at the beginning of the year, the holdings from an International Companies model portfolio are listed in descending order based on percentage owned. Companies that reflect different weights are then selected. For the first quarter, holdings numbered 1, 6, 11, and 16 are selected and discussed. For the second quarter, holdings numbered 2, 7, 12, and 17 are selected and discussed. This pattern then repeats itself for the following quarters. If a holding is no longer in the portfolio then the next holding listed is discussed. Each of these holdings must come from a different country. None of these holdings can be discussed if they were discussed in the previous three quarters. If there were no purchases or sales, the purchases and sales are omitted from the material. If there were multiple purchases and/or sales, the purchase and sale discussed shall be the earliest to occur. Other than the recent buy and sell, any company discussed must constitute at least 1% of the portfolio as of December 31.
The information provided in this material does not provide information reasonably sufficient upon which to base an investment decision and should not be considered a recommendation to buy or sell any particular security. There is no assurance that any of the securities discussed herein will remain in an account at the time this material is received or that securities sold have not been repurchased. The securities discussed do not represent an account’s entire portfolio and in the aggregate may represent only a small percentage of any account’s portfolio holdings. It should not be assumed that any of the securities discussed were or will prove to be profitable, or that the investment recommendations or decisions we make in the future will be profitable or will equal the investment performance of the securities discussed herein. It is possible that a security was profitable over the previous five-year period of time but was not profitable over the last year. In order to determine if a certain security added value to a specific portfolio, it is important to take into consideration at what time that security was added to that specific portfolio. A complete listing of all securities purchased or sold in an account, including the date and execution prices, is available upon request.
The investment objective of a Davis International Equity account is long-term growth of capital. There can be no assurance that Davis will achieve its objective. Davis Advisors uses the Davis Investment Discipline to invest a client’s portfolio principally in common stocks (including indirect holdings of common stock through depositary receipts) issued by foreign companies, including countries with developed or emerging markets. The international companies strategy may invest in large, medium, or small companies without regard to market capitalization. The principal risks are: China risk, common stock risk, depositary receipts risk, emerging markets risk, exposure to industry or sector risk, fees and expenses risk, foreign country risk, foreign currency risk, headline risk, large-capitalization companies risk, manager risk, mid- and small-capitalization companies risk, and stock market risk. See the ADV Part 2 for a description of these principal risks.
We gather our index data from a combination of reputable sources, including, but not limited to, Lipper, Wilshire, and index websites.
The MSCI ACWI (All Country World Index) ex US is a free float-adjusted market capitalization weighted index that is designed to measure the equity market performance of developed and emerging markets, excluding the United States. The index includes reinvestment of dividends, net of foreign withholding taxes. Investments cannot be made directly in an index.
Item #3850 12/23 Davis Advisors, LLC, 2949 East Elvira Road, Suite 101, Tucson, AZ 85756, 800-717-3477