Davis International ADR SMA
Portfolio Commentary
Spring Update 2024
Portfolio Commentary
Spring Update 2024
Key Takeaways
- The MSCI ACWI (All Country World Index) ex US gained 4.69% in the first three months of 2024.
- International equities have underperformed U.S. equities in recent years, but this affords selective investors some wonderful opportunities, especially as the business segments in which we are invested provide nearly perennial fertile ground for investment ideas.
- Asia-Pacific is our largest geographic exposure in Davis International ADR SMA portfolio, followed by developed Europe. Narrowly focused on a small number of companies, the portfolio has an attractive valuation multiple overall, and an exceptionally high earnings yield relative to the risk-free rate.
Market Perspectives:
Looking Beyond the Indexes
In the first quarter of 2024 the MSCI ACWI (All Country World Index) ex US returned 4.69%.
Looking across the globe at the major regions, it is worth asking if the proverbial glass is half full or half empty in terms of economic backdrop and market environment. On the one hand, international equities have dramatically underperformed U.S. equities in recent years. On the other hand, the setup looking forward in international markets affords selective investors some wonderful opportunities, in our view, precisely because they have not fully participated in the U.S. market’s surge. One’s perspective of course depends on the outlook for different country markets and ultimately individual businesses.
Today, the world’s major blocs are operating at rather different speeds. Some of the market darlings command very high valuations—predominantly in developed markets—while companies in emerging markets have generally performed poorly by comparison.
Deep, independent research and staying informed of local dynamics are very important disciplines when investing internationally. Given the crosscurrents and forces at work around the world, and the fact that certain international markets are facing complex challenges, one must proceed in cautious fashion and exercise selectivity when choosing businesses—which requires a willingness to act independently of indexes.
We rigorously study every company in our universe down to the management and their strategy for the business, the nature and sources of revenues and earnings, the strength and liquidity of the balance sheet, competitive position, and addressable market, among many other factors.
We see the glass as half full in the case of our specific international holdings, while also being cognizant of risks. Our businesses are integrated into the fabric of economies, specifically in areas such as banking, e-commerce, residential real estate brokerage, multi-line insurance, food delivery, ride-hailing, semiconductor technologies, copper production and electrical equipment. By and large, we view these areas as nearly perennial fertile ground for investment ideas as they represent enormous and growing profit pools at the industry level.
Europe:
Attractive at the Right Price
Europe today is expanding, albeit slowly. The European Central Bank continues to fight inflation, and so far this year it appears that inflation may be finally moderating on the continent. We do not know if the higher-for-longer scenario for interest rates will prove true. However, we assume internally that rates will be higher than they were over the past decade on average, and that they are once again a factor in market dynamics and pricing, certainly more so than was the case during the “free money” era of ultra-low interest rates following the financial crisis of 2008-2009.
Unemployment rates in Europe suggest the bloc overall is relatively healthy from a jobs standpoint. Strikes and protests have been disruptive and the war in Ukraine could have exogenous impacts on the region, but at the right price a number of European companies look very attractive to us, in spite of those challenges.
Certain European mega banks are in stronger financial condition arguably than even the premier U.S. mega banks. We believe they have ample opportunity to create value for shareholders, for instance, by issuing much larger dividends funded by excess capital and incremental net income, buying in shares while multiples are depressed, and reinvesting in business operations where attractive returns on equity are possible. Despite these attributes, the multiples for European financials are generally quite low. We view this as an opportunity, but one that specifically pertains to premier world-class European institutions and not to the sector as a whole.
Outside of financials, we like the prospects of select industrial companies in electrical equipment, for example, as well as holding companies that trade in Europe but own predominantly internet-based businesses servicing different parts of the world.
Asia-Pacific:
Vulnerable to Good News
Investments in certain emerging markets such as China are very cheap today, and we are willing to take a contrarian stance as long as we believe (a) the businesses we own are fundamentally sound as compounding machines based on their scale, normalized margins, and typical returns on invested capital, (b) valuations are unjustifiably low, and (c) the overall operating environment can improve.
In pursuing such opportunities, we are aware that we assume a degree of “headline (or perception) risk” as negative news headlines may linger for some time—even after the realities on the ground have improved. We lean into controversy at times for the prices it produces, not out of a love for controversy itself, and we feel there are a number of great businesses trading at low valuations in Asia-Pacific presently. As such, Asia-Pacific is our largest geographic exposure followed by developed Europe.
It has been very difficult for the Chinese government to jumpstart the country’s economy after a long period of repressed economic activity that started during COVID. In addition, China’s government took the stance in recent years that it would force real estate development companies to deleverage their balance sheets lest a larger financial systemic risk emerge, which has compounded negative sentiment in the economy. The recent failure of certain Chinese property developers has been interpreted by some as an indication that a major crisis is brewing, one that could pose a risk to financial stability in China more broadly.
We are aware of the challenges facing China today. It has been a surprisingly slow recovery thus far, but we do expect the Chinese economy to recover eventually. We should dispel some of the common thinking around China’s current state.
“From an extremely suppressed level of activity, the incremental growth rates coming out of the post-COVID period in China could conceivably resemble the strong bounces that the U.S. and Europe experienced shortly after lockdowns ended.”
First, while the defaults of certain major property developers in China make headlines, in fact the loans to property developers as a percentage of total loans outstanding in China is roughly 6%. This can still be a pain point at different moments, but overall it seems manageable to us, yet the country is being priced as though the property development market is an existential systemic risk.
China’s economy today is very much consumer- and services-led. We believe the consumers in China will prove far more resilient than some might think. According to the World Bank, per capita income of the country has grown at an average annual rate of more than 6.5% over the last five years,1 or nearly +38% in cumulative terms from 2019 through end-2023. The leverage at the consumer level in China is lower on balance than what is permitted and common in the U.S. Therefore, the income statements and balance sheets of the Chinese consumer look healthier than in many other countries, which is important for assessing resilience.
From an extremely suppressed level of activity, the incremental growth rates coming out of the post-COVID period in China could conceivably resemble the strong bounces that the U.S. and Europe experienced shortly after lockdowns ended. Starting from a low base of economic activity, and with such low multiples, we believe the Chinese investments we hold are simply too cheap to ignore, and vulnerable to good news. Meanwhile, valuations for our Chinese stocks (measured as price-to-earnings multiples) are at mid-single-digit levels, by and large, and they have, in our view, very high potential to grow earnings (at high rates) on a more normalized basis. While we do not know precisely when a turnaround may occur, we are patient and believe, based on our models and experiential perspectives, that we are likely to be adequately compensated for the wait.
While the U.S. press coverage of overseas markets and countries may seem negative currently, we would just point out that this is reflected in much lower valuations for certain international companies.
Portfolio Review:
Structural Earnings Growth
Davis International ADR SMA portfolio’s current positioning can be described first by the following metrics:
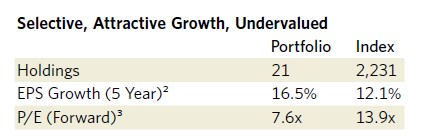
As shown above, the portfolio is narrowly focused by intention, driven by a desire to participate meaningfully in the investment opportunities we uncover. The MSCI ACWI ex US benchmark, by contrast, has 2,231 different securities in it, most of which represent a de minimis share of the index, by definition only capable of influencing its performance marginally.
We like the valuations we currently have in the portfolio which has a forward price-to-earnings (P/E) multiple of roughly 8 times versus roughly 14 times for MSCI ACWI ex US. Inverted, that means the portfolio’s earnings yield is approximately 13% versus about 7% for the risk-free rate. Put another way, if the companies we own were a bond, then the year-one yield (i.e., earnings divided by capital) would be much higher in our businesses than the risk-free alternative. This is a wider valuation gap than we have seen in decades.
Low valuations need not signal low growth. The companies in the portfolio have demonstrated a structural ability to generate high double-digit earnings per share growth over the last five years. We expect those business models to be able to produce attractive growth in the future as well, even if we are seeing in some businesses a relative lull right now.
In Asia-Pacific, we own companies like Itochu, a Japanese financial trading firm that trades commodities and facilitates import/export transactions, among other services. We own companies in e-commerce, food delivery, ride-hailing and semiconductors in China, South Korea and Japan. We also own Ping An, a multi-line Chinese insurer, and the largest bank in Singapore. During the first quarter we sold our position in HollySys, a Chinese automation and technology company that is being taken private at a selling price we feel is attractive.
In Europe, we own a stake in Danske Bank. This was one of our best-performing investments in 2023 as it achieved definitive progress, both in financial terms and relative to regulatory constraints that had been placed on the bank previously for a past money laundering scandal. Effectively, the bank was allowed to grow assets and distribute more of its capital and earnings to shareholders after a long review period, and the dividends have been significant. The bank’s dividend yield now exceeds 7%. Meanwhile, it trades at a modest eight times earnings, its capital ratios are nearly 20%, and its return on equity is approximately 12%. This is the type of investment opportunity we seek in general.
We also own shares of Delivery Hero, which is a Berlin-based online-enabled food delivery service, as well as Ferguson Plc, a U.K.-listed company that is the largest distributor of plumbing and water parts and supplies in the U.S., serving the vast contractor market.
Outlook:
Premier Businesses, Competitive Models
Taken as a whole, we believe Davis International ADR SMA portfolio is a powerful combination of premier businesses with highly competitive business models serving a vast number of different areas of international markets. Given the scale, scope and diversity of international stocks across countries, we believe the glass of opportunity is at least half full for the businesses we favor.
In conclusion, as stewards of our clients’ savings our most important job is growing the value of the funds entrusted to us. With more than $2 billion of our own money invested alongside that of our clients, we are on this journey together.4 This alignment with our clients is uncommon in our industry; our conviction in our portfolio of carefully selected companies is more than just words.
The performance of mutual funds is included in the Composite. The performance of the mutual funds and other Davis managed accounts may be materially different. For example, the Davis International Fund may be significantly larger than another Davis managed account and may be managed with a view toward different client needs and considerations. The differences that may affect investment performance include, but are not limited to: the timing of cash deposits and withdrawals, the possibility that Davis Advisors may not buy or sell a given security on behalf of all clients pursuing similar strategies, the price and timing differences when buying or selling securities, the size of the account, the differences in expenses and other fees, and the clients pursuing similar investment strategies but imposing different investment restrictions. This is not a solicitation to invest in the Davis International Fund or any other fund.
Effective 9/23/14, Davis Advisors created an International Equity SMA Composite which excludes the institutional accounts and mutual funds. Performance shown from 10/1/14, through the date of this material, the Davis Advisors’ International Equity SMA Composite includes all eligible wrap accounts with no account minimum from inception date for the first full month of account management and includes closed accounts through the last day of the month prior to the account’s closing.
A time-weighted internal rate of return formula is used to calculate performance for the accounts included in the Composite. The net of fees rate of return formula is calculated based on a hypothetical 3% maximum wrap fee charged by the wrap account sponsor for all account services. For the gross performance results, custodian fees and advisory fees are treated as cash withdrawals.
Davis Advisors is committed to communicating with our investment partners as candidly as possible because we believe our clients benefit from understanding our investment philosophy and approach. Our views and opinions include “forward-looking statements” which may or may not be accurate over the long term. Forward-looking statements can be identified by words like “believe,” “expect,” “anticipate,” or similar expressions. You should not place undue reliance on forward-looking statements, which are current as of the date of this material. We disclaim any obligation to update or alter any forward-looking statements, whether as a result of new information, future events, or otherwise. While we believe we have a reasonable basis for our appraisals and we have confidence in our opinions, actual results may differ materially from those we anticipate.
This material discusses companies in conformance with Rule 206(4)-1 of the Investment Advisers Act of 1940 and guidance published thereunder. Six companies are discussed and are chosen as follows: (1–4) current holdings based on December 31 holdings; (5) the first new position; and (6) the first position that is completely closed out. Starting at the beginning of the year, the holdings from an International Companies model portfolio are listed in descending order based on percentage owned. Companies that reflect different weights are then selected. For the first quarter, holdings numbered 1, 6, 11, and 16 are selected and discussed. For the second quarter, holdings numbered 2, 7, 12, and 17 are selected and discussed. This pattern then repeats itself for the following quarters. If a holding is no longer in the portfolio then the next holding listed is discussed. Each of these holdings must come from a different country. None of these holdings can be discussed if they were discussed in the previous three quarters. If there were no purchases or sales, the purchases and sales are omitted from the material. If there were multiple purchases and/or sales, the purchase and sale discussed shall be the earliest to occur. Other than the recent buy and sell, any company discussed must constitute at least 1% of the portfolio as of December 31.
The information provided in this material does not provide information reasonably sufficient upon which to base an investment decision and should not be considered a recommendation to buy or sell any particular security. There is no assurance that any of the securities discussed herein will remain in an account at the time this material is received or that securities sold have not been repurchased. The securities discussed do not represent an account’s entire portfolio and in the aggregate may represent only a small percentage of any account’s portfolio holdings. It should not be assumed that any of the securities discussed were or will prove to be profitable, or that the investment recommendations or decisions we make in the future will be profitable or will equal the investment performance of the securities discussed herein. It is possible that a security was profitable over the previous five-year period of time but was not profitable over the last year. In order to determine if a certain security added value to a specific portfolio, it is important to take into consideration at what time that security was added to that specific portfolio. A complete listing of all securities purchased or sold in an account, including the date and execution prices, is available upon request.
The investment objective of a Davis International Equity account is long-term growth of capital. There can be no assurance that Davis will achieve its objective. Davis Advisors uses the Davis Investment Discipline to invest a client’s portfolio principally in common stocks (including indirect holdings of common stock through depositary receipts) issued by foreign companies, including countries with developed or emerging markets. The international companies strategy may invest in large, medium, or small companies without regard to market capitalization. The principal risks are: China risk, common stock risk, depositary receipts risk, emerging markets risk, exposure to industry or sector risk, fees and expenses risk, foreign country risk, foreign currency risk, headline risk, large-capitalization companies risk, manager risk, mid- and small-capitalization companies risk, and stock market risk. See the ADV Part 2 for a description of these principal risks.
We gather our index data from a combination of reputable sources, including, but not limited to, Lipper, Wilshire, and index websites.
The MSCI ACWI (All Country World Index) ex U.S. is a free float-adjusted market capitalization weighted index that is designed to measure the equity market performance of developed and emerging markets, excluding the United States. The index includes reinvestment of dividends, net of foreign withholding taxes. Investments cannot be made directly in an index.
Item #3850 3/24 Davis Advisors, LLC, 2949 East Elvira Road, Suite 101, Tucson, AZ 85756, 800-717-3477