Davis All-Cap SMA
Portfolio Commentary
Spring Update 2024
Portfolio Commentary
Spring Update 2024
Key Takeaways
- The S&P 1500 Index gained 10.31% in the first quarter of 2024 against a fairly strong economic backdrop in the U.S., with low unemployment and generally moderating inflation.
- In its current positioning, the U.S. stock market presents concentration and valuation risks. However, we believe it is still possible to buy businesses today that can achieve attractive economics yet trade at decent valuations.
- Our All-Cap SMA portfolio is focused on just 31 companies, all with attractive characteristics— free cash flow, opportunities to reinvest earnings and capital at relatively high rates, and wide competitive moats.
Market Perspectives:
Looking Beyond the Index
The S&P 1500 Index returned 10.31% in the first three months of 2024, building further on its 25.47% advance in 2023.
The economic backdrop remains fairly strong with the U.S. economy still expanding. Unemployment remains below 4% and inflation, while still evident, appears to be attenuating versus its level two years ago. The Federal Reserve has indicated a willingness to lower interest rates when it has greater conviction that inflation has definitively cooled. A relatively benign economic picture can no doubt be favorable for businesses.
The current positioning of the U.S. stock market presents some concentration and valuation risks that can be mitigated in our view with active management. Specifically, we note that the S&P 1500 Index’s top 10 positions now constitute approximately 31% of the index’s entire market cap. This is very concentrated relative to history, and the average valuation for those 10 stocks is relatively high.
The way to navigate such markets in our experience is to look far beyond the top holdings of the index. We believe it is possible to buy businesses today that are capable of achieving very attractive economics yet trade at decent valuations. Our portfolio is focused on opportunities that stand out in their individual quantitative and qualitative strengths yet are in many cases hardly represented in the index at all.
In contrast to passive index construction, which is driven by market capitalization, we are invested in a range of businesses that we select one at a time and which we manage in an active, judgment-supported way. We assign weightings and ranges for each of our positions based on business qualities and valuation parameters that we feel are appropriate and backed up by deliberate thought. We believe this combination of conscious selectivity and valuation discipline will be key to building value for shareholders over the long term, starting from today’s levels.
Portfolio Review:
Premier Businesses at Undervalued Prices
Davis All-Cap SMA portfolio is one way investors can access premier, durable businesses that are still at value prices, in our opinion, with the intention of holding them for the long term.
In the first quarter of 2024 the portfolio’s value rose but its performance trailed the S&P 1500 Index slightly after being roughly in line with the Index in 2023. We believe the environment today favors active management for two reasons. First, many quality businesses that are not as widely held or as well-known as the Magnificent 71 are on sale at very attractive prices. Second, the structure of the S&P 1500 Index is not optimal, in our view. It is concentrated in very high-multiple technology stocks so that most other constituents are represented by de minimis position sizes, which limits many good businesses from contributing to index performance. Our gains in 2023 and this year have been built on investments that met our strict business criteria coupled with what we felt were attractive valuations at the time of purchase. Many of them started at such low multiples that although they have appreciated greatly, they remain attractively valued.
In terms of our current positioning, below we provide the number of holdings in the portfolio along with the average five-year earnings per share (EPS) growth rate and forward price-to-earnings (P/E) multiple, as compared with the S&P 1500 Index:
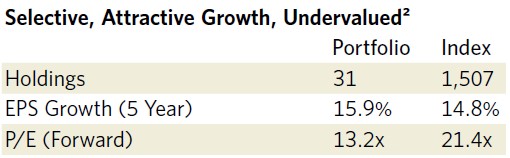
What these figures show among other things is that we are highly selective. Our portfolio is focused on only 31 companies presently, all of which we have chosen on an individual, case-by-case basis. In our opinion, each of these businesses possesses attractive characteristics. As a rule, our businesses generate free cash flow, have opportunities to reinvest earnings and capital at relatively high rates, and have wide competitive moats, according to our analysis.
The trailing five-year earnings per share growth rate of 16% for the portfolio exceeds the S&P 1500 Index’s impressive mid-teens growth rate. However, our portfolio trades at a 38% discount to the index portfolio on a forward P/E basis. Favoring premier, well-researched businesses at undervalued prices is at the heart of our investment discipline. It is how we construct portfolios that are differentiated from the market and from peers, and we believe it is a sensible and perennial way to invest in equities over the long term.
Presently, the major themes at work in our portfolio selections include:
Healthcare: A Rich Ecosystem
Our healthcare positions include two of the largest managed care health insurers in the country, an independent labs and diagnostics service provider, and Viatris, a large manufacturer of generic pharmaceuticals.
The demographics case for healthcare suggests a future where demand and spend for healthcare products and services are likely to rise. The national need for health insurance as well as for tests and generics presents a rich ecosystem that attracts us. That said, we are proceeding with caution on price because much of the for-profit healthcare industry relies on government reimbursement rates set through Medicare and Medicaid, which can be capricious, especially when the country is faced with budgetary constraints. Therefore, we have been thoughtful about which healthcare stocks to own based on our view of longevity and durability, as well as the multiples we are willing to pay. We believe our healthcare companies are generally vulnerable to good news based on their current valuations, but note that the opposite may apply in the case of some of today’s high flyers that we do not own.
Financial Services: Micro-Level Nuances
Our financials weighting must be broken down into constituent parts to describe the specific investment opportunities we are pursuing in a properly nuanced fashion.
Consumer finance and megacap banks, which are usually considered the archetypal financial services business type, represent approximately 21.20% of our portfolio. These holdings generally have forward P/E multiples between 10 and 13 times, with dividend yields ranging from 1% to 2%. They include some of the mega banks in the marketplace with strong brands, enormous installed bases of capital and technology infrastructure, proven leadership and, in our estimation, higher per-share earnings growth potential than meets the eye.
In addition, the portfolio holds Markel Corp., which we consider a “non-financial financial” by virtue of its multi-industry business lines and make-up. By non-financial financial we mean multi-industry conglomerates that are classified as financial businesses due to one or more of their core businesses operating in financial services (property casualty insurance and reinsurance, primarily). This categorization is only partially correct as other businesses within those conglomerates run the gamut in terms of non-financial industries.
Technology: Following the Profit Pools
In the broad technology sector, we currently favor companies that are market leaders in e-commerce, cloud computing, social media and advertising, and online search. These sub-areas of technology are all quite mature, but we believe they are poised to generate much larger revenues and profits over time, however uneven their results could be in shorter time periods.
We have always had a prominent technology exposure in Davis All-Cap SMA portfolio, and the portfolio is evidence that it is possible to own growth at value prices. Since its inception in 1969, Davis Advisors has held some portion of our portfolios in technology companies, making this a core competency for our research team. In addition to having a finger on the pulse of one of the most dynamic sectors of the market, we also benefit from the insights that technology companies give as to how certain business models or even whole industries are being reimagined.
“We like companies with a dominant or rising share of growing markets, and we believe that global retail volume, while in the tens of trillions of dollars worldwide each year, still offers a long runway to cutting edge e-commerce leaders.”
Having that early line of sight to a future where business models could be disrupted is especially important in today’s fast-changing world. As investors, we need to be perceptive of change, especially tidal sea changes that become new paradigms. The phenomenon of the internet presaged the days when retail would be conducted increasingly online. As such, we began taking today’s e-commerce giants very seriously at an early stage after their IPOs.
E-commerce, while already producing stunningly large, advanced and successful companies, is still at the very early stages of its long-term story, in our opinion. Modern retail has arguably been a force since the creation of the department store in the late 1800s. Retail dollars continue to flow today, but the intermediary position between merchant and consumer is increasingly moving online and is dominated by a handful of platforms. We like companies such as Amazon.com that enjoy a dominant or rising share of growing markets, and we believe that global retail volume, while in the tens of trillions of dollars worldwide each year, still offers a long runway to cutting edge e-commerce leaders. There are risks, of course, including overpaying to own a position or the threat to these companies of antitrust regulatory actions, both of which we consider in how we weight our portfolio positions and time our decisions.
Advertising and print media were other markets that were directly and permanently upended by the internet. Today, social media and online search dominate the advertising industry by and large.
Social media and online search are fundamentally advertising businesses at their core. The largest players in the space leverage their vast data pools derived from user bases that count billions of people worldwide. In the case of social media, the value delivered to advertisers may not be apparent to a typical user, but the ability to mine such vast troves of information and dynamically manage campaigns for awareness, engagement and sales (in that order) is a nontrivial value proposition. The analytics attached to social media ad campaigns also deliver enormous value in the sense that such metrics can help advertisers make budgeting decisions, direct their efforts towards finely defined, target-rich demographics, and empirically measure impact, effectiveness and cost per user.
These techniques have existed for a long time, but today’s technology tools (including artificial intelligence) have largely replaced slow, expensive focus groups, telephone surveys, and so forth. As e-commerce has disrupted the offline retail world, so too have the major social media companies caused structural change to the traditional advertising and market research firms of times past.
“We were relatively early to acknowledge the new realities, still interested in accessing the same historical profit pools as before, just through those next-generation business models that would take share from the old guard."
Online search has similar features to social media with respect to advertising insofar as user bases of billions of people allow businesses to “advertise” based on search engine optimization and effectively pay to appear in rankings among search results. This is akin to the ways that the Yellow Pages once gave prominence visually to larger advertisers, but is far, far more scalable and intelligent. Once more, what used to be offline has gone effectively 100% online today.
History forces investors at times to think critically about how they wish to access a large profit pool if it moves online. In the case of retailing and advertising, we have not held direct storefront retailers for some time, and we exited newspapers decades ago, in both cases in favor of online new entrants that have become behemoths today. This may have caused some to ask if we were trying something new by investing in online companies. Our position was that we were just relatively early to acknowledge the new realities. We were still interested in accessing the same historical profit pools as before, just through those next-generation business models that would take share from the old guard.
In the more traditional technology areas, we also hold a number of semiconductor-related companies, including Texas Instruments. Electronic content has been expanding and evolving at a fast pace for decades, well before and beyond anything AI-related.
But the trend is accelerating, hence the strong demand for chips in computers, communications devices, sensors, automobiles, airplanes, consumer electronics, appliances, and so forth. We want to own companies that participate in long-tailed growth but have selected our semiconductor names at valuations we feel allow us some margin of safety versus some of the most popular stocks today, which are trading at multiples outside of our range. Nothing in the market grows in a straight line and semiconductor technologies are no different. There are cyclical dynamics in the industry that may or may not be appropriately reflected in the stock prices of some of the market’s current darlings. We are happy to own part of the group but pay more reasonable prices for the opportunity.
Industrials: Boring But Beautiful
Another theme in the portfolio is industrial companies which we consider “boring but beautiful” business models. We own shares of Ferguson plc, the largest distributor of plumbing, heating and water supplies in the U.S., and Owens Corning, a leader in roofing and insulation products. Up until recently we also held Eaton Corp. which we sold due to valuation.
We also hold positions specialized in gaming (offline and online), biofuel, and agriculture equipment and processes, among others.
The common thread running through the portfolio is that we selected each holding individually based on deep independent research for reasons having to do with business strength and valuation.
In the most recent quarter, we sold our position in Eaton Corp. based on valuation.
Outlook:
Conscious Capital Allocation
With just 31 holdings, the portfolio is constructed such that each position has the potential to contribute to our long-term results. Meanwhile, in a market where common indexes are heavily concentrated in high-multiple stocks (with the S&P 1500 Index surpassing 21 times earnings), it is noteworthy that Davis All-Cap SMA portfolio has a forward P/E multiple of only 13.2 times. We regard this as an attractive starting point for the future and for a portfolio that was capable of generating an average 16% earnings per share growth annually over the last five years.
The stock market is really a market of individual stocks. Given major changes afoot in the economy, some of which are temporary and others of which are secular and likely permanent, we believe our approach of researching companies thoroughly and then allocating capital in conscious, thoughtful ways has advantages relative to investing in high-multiple benchmark indexes at current levels.
In conclusion, as stewards of our clients’ savings our most important job is growing the value of the funds entrusted to us. With more than $2 billion of our own money invested alongside that of our clients, we are on this journey together.3 This alignment with our clients is uncommon in our industry; our conviction in our portfolio of carefully selected companies is more than just words.
The performance of mutual funds is included in the Composite. The performance of the mutual funds and other Davis managed accounts may be materially different. For example, the Davis Opportunity Fund may be significantly larger than another Davis managed account and may be managed with a view toward different client needs and considerations. The differences that may affect investment performance include, but are not limited to: the timing of cash deposits and withdrawals, the possibility that Davis Advisors may not buy or sell a given security on behalf of all clients pursuing similar strategies, the price and timing differences when buying or selling securities, the size of the account, the differences in expenses and other fees, and the clients pursuing similar investment strategies but imposing different investment restrictions. This is not a solicitation to invest in the Davis Opportunity Fund or any other fund.
Davis Advisors is committed to communicating with our investment partners as candidly as possible because we believe our clients benefit from understanding our investment philosophy and approach. Our views and opinions include “forward-looking statements” which may or may not be accurate over the long term. Forward-looking statements can be identified by words like “believe,” “expect,” “anticipate,” or similar expressions. You should not place undue reliance on forward-looking statements, which are current as of the date of this material. We disclaim any obligation to update or alter any forward-looking statements, whether as a result of new information, future events, or otherwise. While we believe we have a reasonable basis for our appraisals and we have confidence in our opinions, actual results may differ materially from those we anticipate.
The Davis All-Cap Equity is represented by Davis Advisors’ Multi-Cap Equity Composite.
Performance shown from 1/1/99, through 12/31/05, is the Davis Advisors’ Multi-Cap Composite which includes all actual, fee-paying, discretionary Multi-Cap investing style institutional accounts, mutual funds, and wrap accounts under management including those accounts no longer managed. Effective 1/1/98, a minimum account size of $3,500,000 was established. Accounts below this minimum are deemed not to be representative of the Composite’s intended strategy and as such are not included in the Composite. A time-weighted internal rate of return formula is used to calculate performance for the accounts included in the Composite. For the net of advisory fees performance results, custodian fees are treated as cash withdrawals and advisory fees are treated as a reduction in market value. For mutual funds, the Composite uses the rate of return formula used by the open-end mutual funds calculated in accordance with the SEC guidelines adjusted to treat mutual fund expenses other than advisory fees as cash withdrawals; sales charges are not reflected.
Effective 1/1/11, Davis Advisors created a Multi- Cap (SMA) Composite which excludes institutional accounts and mutual funds. Performance shown from 1/1/06, through 12/31/10, the Davis Advisors’ Multi-Cap SMA Composite includes all eligible wrap accounts with a minimum account size of $3,500,000 from inception date for the first full month of account management and includes closed accounts through the last day of the month prior to the account’s closing. For the performance shown from 1/1/11, through the date of this material, the Davis Advisors’ Multi-Cap SMA Composite includes all eligible wrap accounts with no account minimum from inception date for the first full month of account management and includes closed accounts through the last day of the month prior to the account’s closing. Wrap account returns are computed net of a 3% maximum wrap fee. For the gross performance results, custodian fees and advisory fees are treated as cash withdrawals. A list of Davis Advisors’ Composites is available upon request.
This material discusses companies in conformance with Rule 206(4)-1 of the Investment Advisers Act of 1940 and guidance published thereunder. Six companies are discussed and are chosen as follows: (1-4) current holdings based on December 31 holdings; (5) the first new position; and (6) the first position that is completely closed out. Starting at the beginning of the year, the holdings from a Multi- Cap Equity model portfolio are listed in descending order based on percentage owned. Companies that reflect different weights are then selected. For the first quarter, holdings numbered 1, 6, 11, and 16 are selected and discussed. For the second quarter, holdings numbered 2, 7, 12, and 17 are selected and discussed. This pattern then repeats itself for the following quarters. If a holding is no longer in the portfolio then the next holding listed is discussed. No more than two of these holdings can come from the same sector per piece. None of these holdings can be discussed if they were discussed in the previous three quarters. If there were no purchases or sales, the purchases and sales are omitted from the material. If there were multiple purchases and/or sales, the purchase and sale discussed shall be the earliest to occur. Other than the recent buy and sell, any company discussed must constitute at least 1% of the portfolio as of December 31.
The information provided in this material does not provide information reasonably sufficient upon which to base an investment decision and should not be considered a recommendation to buy or sell any particular security. There is no assurance that any of the securities discussed herein will remain in an account at the time this material is received or that securities sold have not been repurchased. The securities discussed do not represent an account’s entire portfolio and in the aggregate may represent only a small percentage of any account’s portfolio holdings. It should not be assumed that any of the securities discussed were or will prove to be profitable, or that the investment recommendations or decisions we make in the future will be profitable or will equal the investment performance of the securities discussed herein. It is possible that a security was profitable over the previous five year period of time but was not profitable over the last year. In order to determine if a certain security added value to a specific portfolio, it is important to take into consideration at what time that security was added to that specific portfolio. A complete listing of all securities purchased or sold in an account, including the date and execution prices, is available upon request.
The investment objective of a Davis Multi-Cap Equity account is long-term growth of capital. There can be no assurance that Davis will achieve its objective. Davis Advisors uses the Davis Investment Discipline to invest a client’s portfolio principally in common stocks (including indirect holdings of common stock through depositary receipts). The Multi-Cap Equity strategy may invest in large, medium, or small companies without regard to market capitalization and may invest in issuers in foreign countries, including countries with developed or emerging markets. The principal risks are: common stock risk, depositary receipts risk, emerging markets risk, fees and expenses risk, foreign country risk, foreign currency risk, headline risk, large-capitalization companies risk, manager risk, mid- and smallcapitalization companies risk, and stock market risk. See the ADV Part 2 for a description of these principal risks.
Small cap companies have market capitalizations less than $3 billion. Mid cap companies have market capitalizations from $3 billion to $10 billion. Large cap companies have market capitalizations greater than $10 billion. Under normal circumstances, the Multi-Cap Equity Composite invests the majority of its assets in equity securities issued by companies with market capitalizations of less than $20 billion.
We gather our index data from a combination of reputable sources, including, but not limited to, Lipper, Wilshire, and index websites.
The S&P 1500 Index is comprised of the S&P 500, MidCap 400, and SmallCap 600, which together represent approximately 90% of the U.S. equity market. Investments cannot be made directly in an index.
Item #3838 3/24 Davis Advisors, 2949 East Elvira Road, Suite 101, Tucson, AZ 85756 800-717-3477, davisadvisors.com